Overview
Our widget integrates with Google Tag Manager container, enabling the widget event stream to be connected with Google Marketing Platform products. In this guide, we'll demonstrate this using Google Analytics 4.
To ensure ease of use with data transmitted by the widget, we have defined a series of dimensions and events. Their full manual configuration in Google Tag Manager is time-consuming. Therefore, we offer implementation using a JSON file that can be imported into the Google Tag Manager container in merge mode. Then, after setting up the target Google Tag identifier, data is forwarded to the specified Google Analytics 4 property. From this point forward, you have an environment integrated with the TrueEngage widget that can be further customized according to specific implementation needs.
Events emited by widget
Widget Event Tracking enables better understanding of visitor interactions and facilitates improvements to service performance. For example, it helps identify which subpages benefit from widget usage, or on which subpages engagement features are recommended.
To keep the number of event tags in GTM (Google Tag Manager) compact, dimensions have been defined. These dimensions, combined with events, allow efficient definition of events we want to track. For instance, we use a single event to signal a conversation. Thanks to the channel dimension, we can specify whether we're counting all communication types or only selected channels.
Below is a list of events emited to Google Tag Manager data layer:
| Tag name | Description | Data |
| te_widget_prepared | It tracks when the widget is loaded. | {event: ‘te_widget_prepared’ visitor_id: … widget_id: … widget_name: …} |
| te_button_shown | It tracks when the widget is shown on page and it is offering service to visitors. | {event: ‘te_button_shown’ visitor_id: … widget_id: … widget_name: …} |
| te_engagement_headsup_shown | It tracks when the text buble is shown. | {event: ‘te_engagement_headsup_shown’ visitor_id: … widget_id: … widget_name: …} |
| te_engagement_widget_opened | It tracks when widget is opened (widget popup) | {event: ‘te_engagement_widget_opened’ visitor_id: … widget_id: … widget_name: … channel: <channel>} |
| te_channel_opened | It tracks when visitor navigates between channels. | {event: ‘te_channel_opened’ visitor_id: … widget_id: … widget_name: … channel: <channel>} |
| te_channel_initiated | It tracks when visitor start using a given channel. Additional data legend: confirmed - this flag indicates if visitor started |
{event: ‘te_channel_initiated’ visitor_id: … widget_id: … widget_name: … channel: <channel> confirmed: true | false} |
The following dimensions are defined in the system:
-
visitor_id - visitor identifier; if a visitor returns to the page multiple times, the identifier value remains unchanged
-
widget_id - numerical widget identifier
-
widget_name - widget friendly name
-
channel - communication channel type:
- 'channel_picker' - represents the widget tab where communication channels can be selected
- 'chat' - represents text chat communication
- 'facebookMessenger' - represents communication via Facebook Messenger
- 'whatsapp' - represents communication via WhatsApp
- 'audio' - represents audio communication
- 'video' - represents video communication
- 'callback' - represents the callback method selection tab
- 'schedule' - represents the tab for scheduling a conversation at a specific date
- 'scheduledVideo' - represents the tab for scheduling a video conversation at a specific date
- 'faq' - represents navigation to the knowledge base tab
- 'form' - represents navigation to the form tab
-
confirmed - this dimension has a value of
truewhen we're certain the visitor established communication through the selected channel. If the channel provider doesn't deliver information about message delivery or conversation initiation, the value remainsfalse.For example, when clicking on a communication channel opens a link to a form subpage, we don't track whether the visitor actually submits the form. We only signal that the visitor opened the communication channel with
confirmed = false.Installation
TrueEngage panel
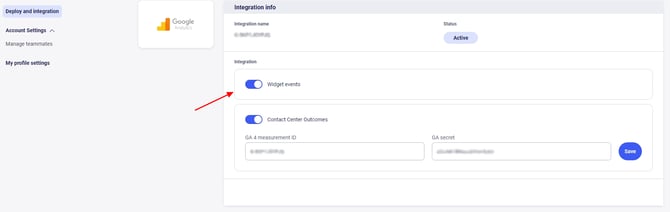
In order for TrueEngage to send events, you need to enable the appropriate flag in the settings. To do this in TE Panel go to Settings tab → Deploy and Integration. Enable the option to start collecting data.
Google Analytics 4 Event Tracking with Google Tag Manager
Here's a step-by-step guide on how to configure tracking in Google environement.
Requirements: If you have an existing container in Google Tag Manager use it, if not create a new one using this instruction: https://support.google.com/tagmanager/answer/12974036?hl=en&ref_topic=3441530&sjid=6989127869182817959-EU
1. Import Trueengage variables, tags, triggers to GTM container
We have prepared a JSON configuration containing only the elements necessary for implementing the integration.
Download the file:
Then import the above configuration into your GTM container, selecting the following options:
- Merge mode with option: Rename conflicting tags, triggers, and variables
If you encounter any difficulties, here is the detailed import instruction for GTM: https://support.google.com/tagmanager/answer/6106997?hl=en
2. Setup variable TagGoogleID
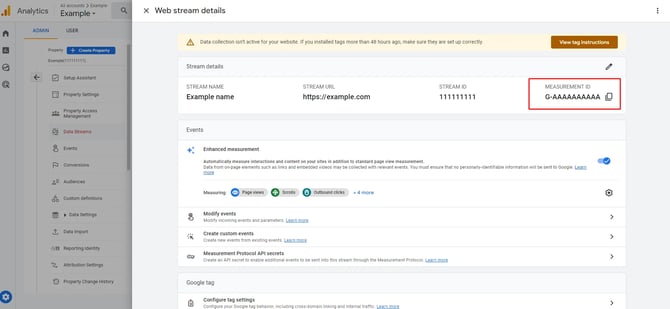
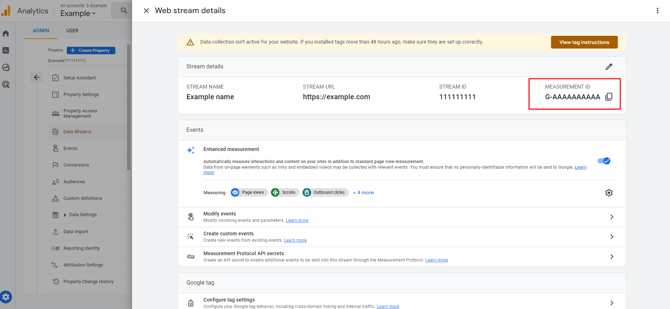
STEP 1. In Google Analytics 4, we go to Settings → Data Streams tab and select appropriate stream, there you find measurement id
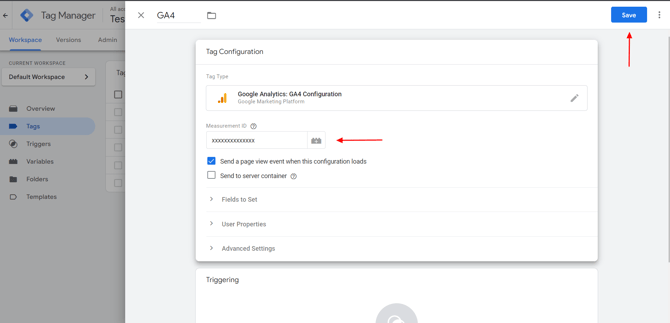
STEP 2. In GTM go to Variables -> find the variable TagGoogleID and set its value to your Measurement ID.
Test and publish your tags
Once you've set up your tags, you'll need to test them to make sure they're working correctly. Here's how you can do it:
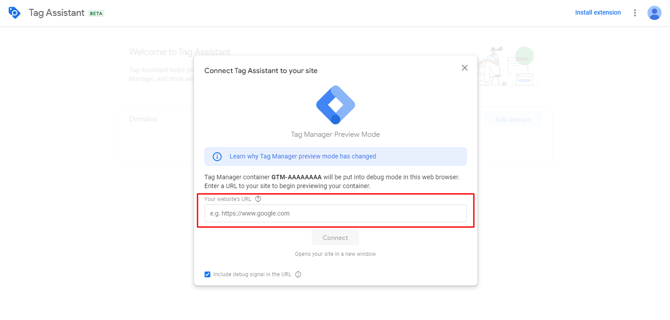
1. Go to the Preview and Debug mode in Google Tag Manager.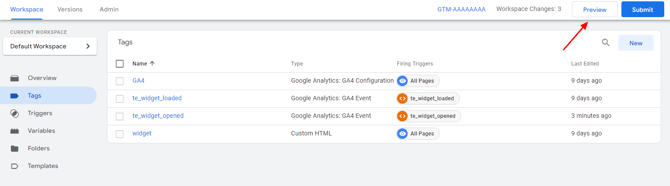
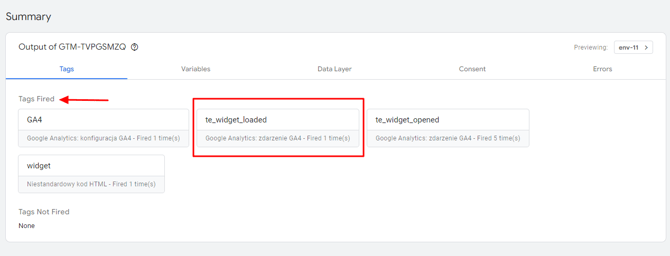
4. Check the Google Tag Manager debugger to make sure the TrueEngage events are being sent to your Google Analytics 4 property correctly.
Google Analytics
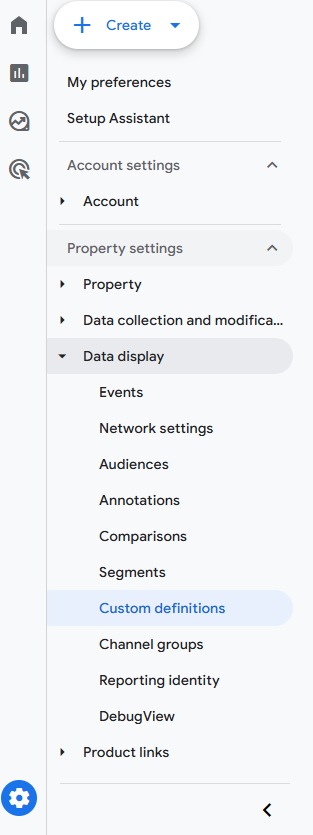
To use data integration through Google Tag Manager, you need to define custom dimensions and custom metrics. To do this, in Google Analytics go to Admin → Property settings → Custom definitions.
Add dimension definitions according to the table (into Custom dimensions tab).
| Dimension name | Scope | Event parameter | Description |
|---|---|---|---|
| Trueengage channel | Event | te_channel | It allows to categorize events by widget channel |
| Trueengage widget | Event | te_widget_name | It allows to categorize events by widget |
| Trueengage funnel | Event | te_widget_funnel | It allows to prepare funnel report for phases: 1 Engagement headsup shown 2 Engagement widget opened 3 Widget opened 4 Channel opened 5 Channel initiated |
Add metrics definitions according to the table (into Custom metrics tab).
| Metric name | Scope | Parameter name | Unit of measurement |
|---|---|---|---|
| Trueengage widget prepared | Event | te_f_widget_prepared | Standard |
| Trueengage button shown | Event | te_f_button_shown | Standard |
| Trueengage engagement headsup shown | Event | te_f_engagement_headsup_shown | Standard |
| Trueengage engagement widget opened | Event | te_f_engagement_widget_opened | Standard |
| Trueengage widget opened | Event | te_f_widget_opened | Standard |
| Trueengage channel opened | Event | te_f_channel_opened | Standard |
| Trueengage channel initiated | Event | te_f_channel_initiated | Standard |
| Trueengage channel initiated confirmed | Event | te_f_confirmed | Standard |
| Trueengage connection established | Event | te_f_connection_established | Standard |
| Trueengage connection unestablished | Event | te_f_connection_unestablished | Standard |
| Trueengage connection status | Event | te_f_connection_status | Standard |
Based on the prepared metrics, we can create sample reports:
- Identification of which pages have high widget usage
- Identification of how frequently visitors use widgets
- Verification of communication channel popularity per widget
- Funnel report for the widget
- Tracking of communication effectiveness from widget click to callback realization through Genesys
- Verification of business results per communication channel
Example reports:
Below we present how using several GA4 report groups prepared for this integration help us understand the role of the widget. Starting with the widget user journey report group where we learn about widget usage. Then through channel preferences reports we observe visitors' preferences for selected channels. Finally, the widget funnel report presents widget usage from the customer's perspective.
-
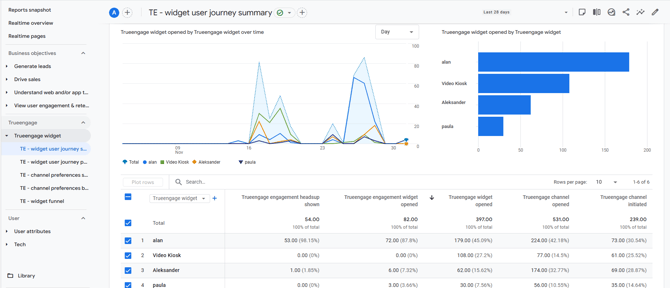
TE - widget user journey summary
This report allows you to understand the contribution of individual widgets in the system from a bird's-eye view, both in terms of widget-to-widget comparison and the proportion of events for the subsequent phases of an individual widget.
-
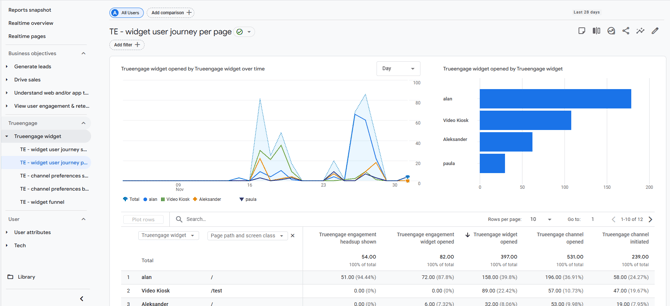
TE - widget user journey per page
This report allows you to understand for which subpages visitors choose to use the widget. It is worth noting that GA4 allows for the interactive selection of the metric by which we sort the observations. Consequently, a single report enables the verification of popularity, usefulness, and anomalies for which individual pages see increased widget usage.
-
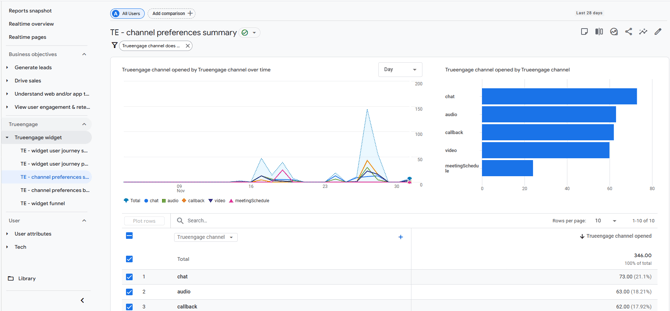
TE - channel preferences summary
The preferences report group is a source of knowledge about visitor preferences regarding the use of communication channels. The summary report outlines which channels are popular for the selected widget and shows how popularity varies depending on the timeline.
-
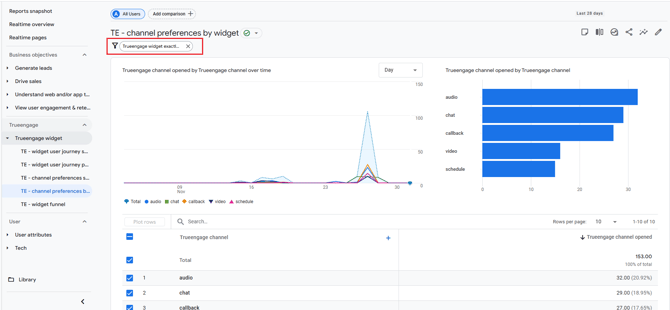
TE - channel preferences by widget
This report allows you to filter data for a selected widget and perform popularity analyses as described above.
-
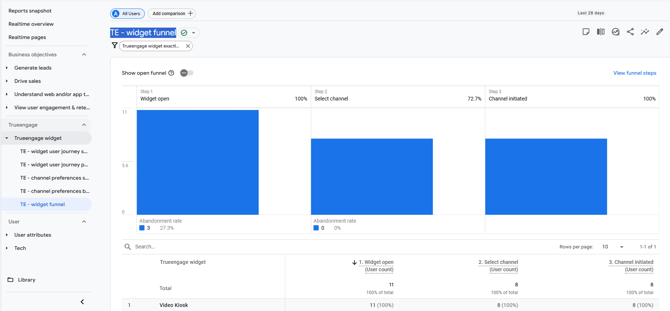
TE - widget funnel
This report is helpful when we want to understand the widget usage funnel from the visitor's perspective. The created summary presents how the selection of subsequent widget options progresses per customer.
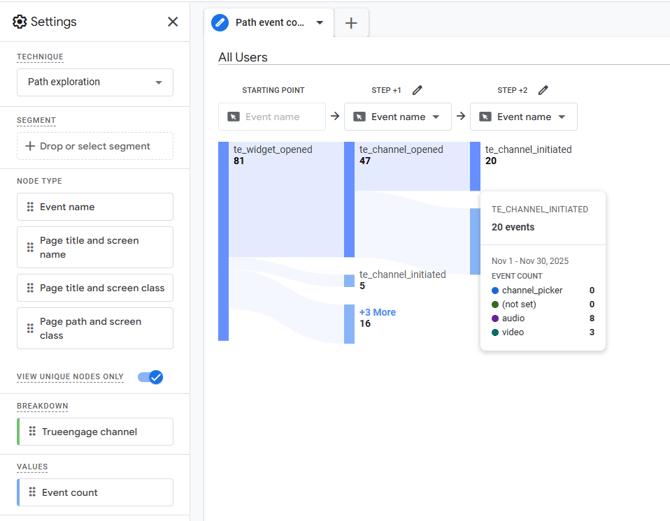
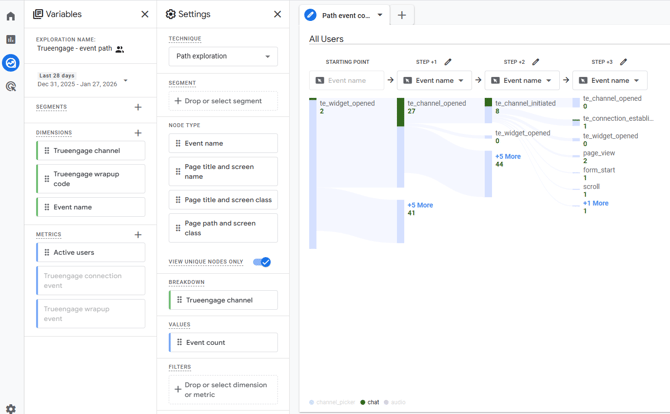
- TE - path exploration To understand the choices of visitors, we can conduct path exploration.
-
For a more comprehensive insight, we propose a breakdown per channel. Below is an example chart from which we can read how many visitor interactions with the widget were recorded, broken down by communication channel popularity.
-
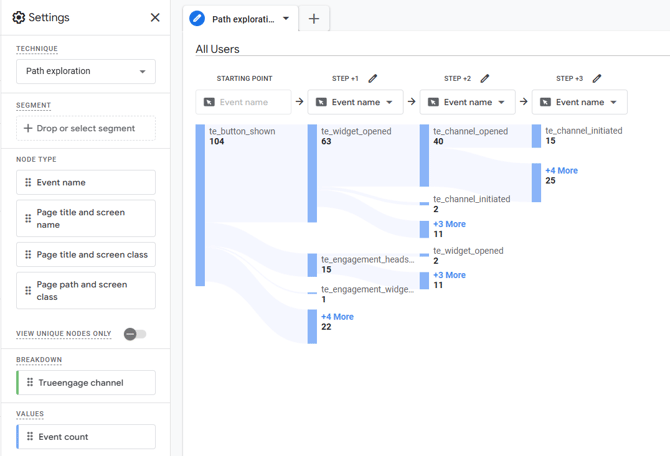
An alternative approach is to preview the total users metric using path exploration

-
-
Offline events integration
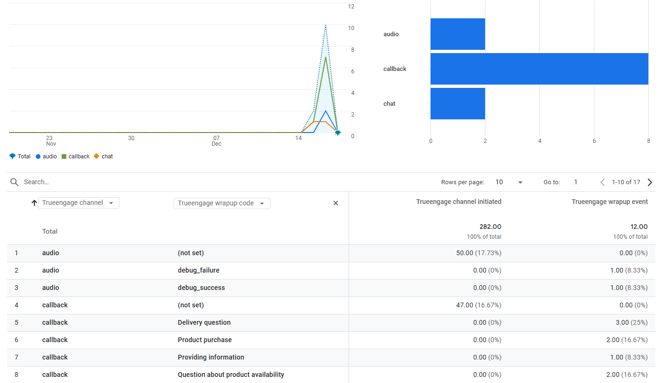
Integrating offline events is particularly attractive for callback and scheduled callback interactions. This allows us to observe flows that are extended over time (for example, whether visitors return to scheduled calls). The report below presents a sample summary illustrating the wrap-up results for interactions initiated in the widget.
Offline genesys events
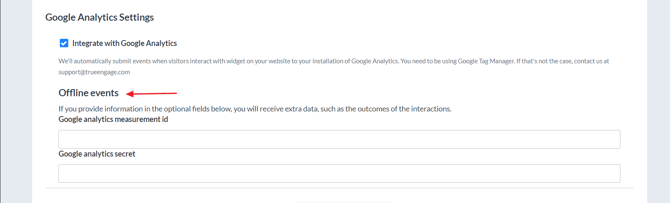
If you want to receive additional analytical data not available from the site - you can configure to receive offline events. To do this, go to TrueEngage panel Settings -> Deploy tab and configure the fields:
- Google analytics measurement id
- Google analytics secret
Offline events are available for the following channels:
- Web Chat
- Call
- Callback
- Scheduled Callback
- Video Call
- Scheduled Video
Once the offline events are configured, TrueEngage will send additional dataset:
| Property | Description |
|---|---|
| client_id | Google Analytics client identifier used to track user sessions |
| te_visitor_id | Unique identifier for the visitor in TrueEngage system |
| te_widget_name | Name of the widget that triggered the event |
| te_channel | Communication channel used (e.g., Web Chat, Call, Callback) |
| te_outcome | Wrap-up code set in Genesys Cloud by the Agent after the interaction |
| te_event_category | Event category classification (set to "offline" for offline events) |
| te_f_outcome | Flag indicating outcome event occurred (set to 1) |
Example reports
1. Path exploration reportsThe two reports below present in graphical form how the widget operation flows and the final realization of the connection with the CC agent.
a. Trueengage - total users path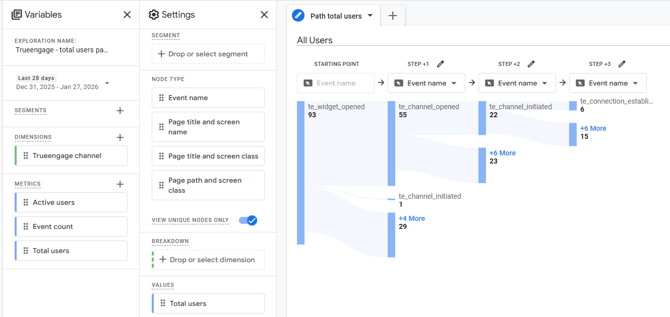
b. Trueengage - event path
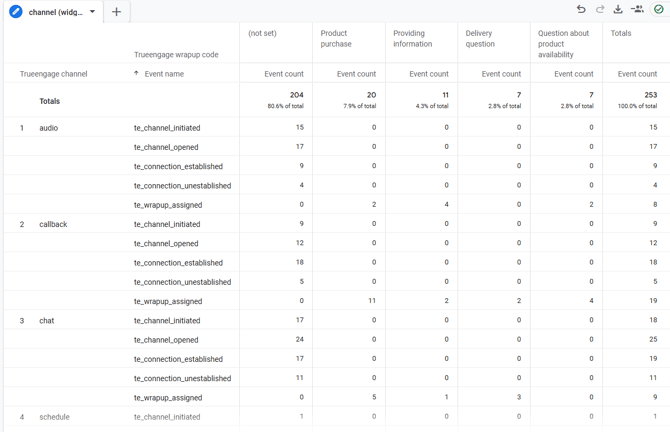
The report below allows you to track the flow of using a selected channel, starting from events on the website and ending with statuses generated on the contact center side. In the prepared report, we can see how many visitors selected a given channel on the widget (te_channel_opened). Then they used this channel for communication (te_channel_initiated). Subsequently, we report what happened on the contact center side:
- call realization:
- connection established (te_connection_established),
- connection not established (te_connection_unestablished)
- wrap-up code left (te_wrapup_assigned)
For example, for the callback channel, we can see that this tab was opened 95 times, callback was requested 6 times, of which 3 connections were successful. All connections ended with the Delivery question status.
Appendix
1. Get measurement id
In Google Analytics 4, we go to Settings → Data Streams tab and select appropriate stream, there you find measurement id
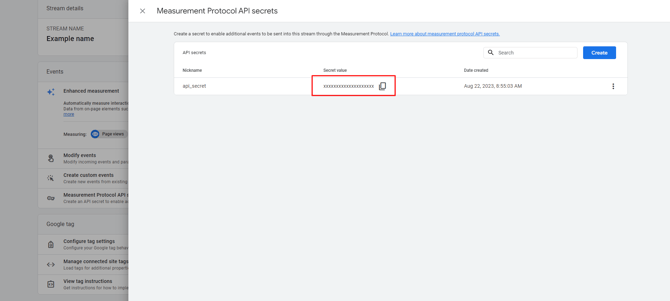
2. Generate API Secret
STEP 1.
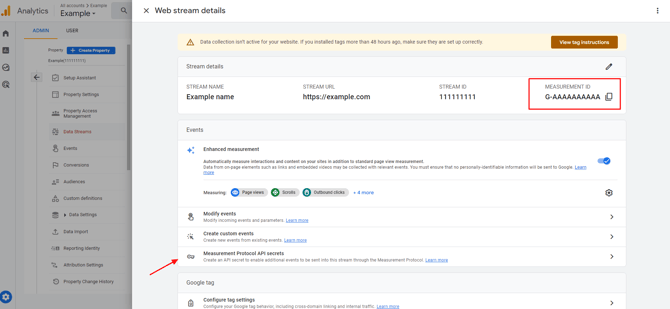
To generate API secret go in Web stream details to Measurement Protocol API secrets
STEP 2.
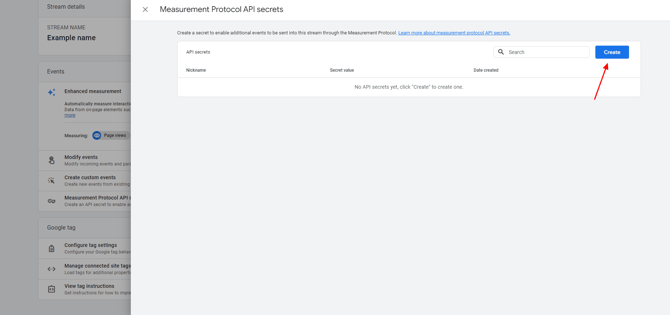
Click on Create button and name your secret for example api_secret
STEP 3.
Done! Your API secret has been created and you can enter it in the Trueengage panel